Table of Contents
Options and Controls
Scan&Solve offers several options and controls that can be used to analyze results:
Deflected View
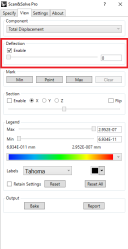
The Deflection slider provides an interactive mechanism for visualizing the magnified deflection the geometry experiences under the specified loads and restraints. In addition to the slider method of entry, a numeric value may be entered in the edit box. The deflected shape is the result of a linear extrapolation of the static displacement and should not be construed as the actual deflected shape.
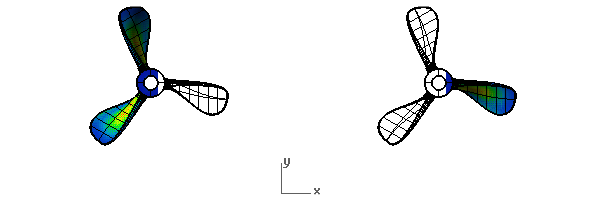
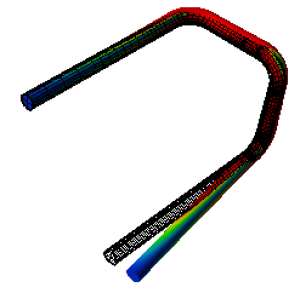
The following is an example of a solid that has been deflected. The wireframe shape represents the original view of the solid, the rendered shape is the deflected view.
Watch Intact Solutions' video “Getting Started with Scan&Solve Pro Part 2: Analyzing Results” from 0:52 to learn more about using the deflection slider.
Back to Top
Point Queries
 Scan&Solve Pro will place leaders in the model pointing out the location and value of the displayed solution quantities. These leaders will only display under view types that will also allow annotations to be displayed (wireframe, shaded, ghosted, x-ray). The leader text size is controlled by Rhino's dimension scale and text height settings.
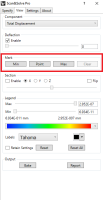
The marking capabilities are accessed through the following three buttons:
[Min] marks the location of the minimum value of the active solution component. [Point] marks the value of the active solution component at a point selected on the model. [Max] marks the location of the maximum value of the active solution component.
Example
The following is an example of a solid with a point query placed at the Maximum and at a random point.
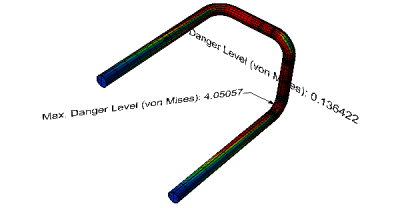
Watch Intact Solutions' video “Getting Started with Scan&Solve Pro Part 2: Analyzing Results” from 1:09 to learn more about the mark group.
Back to Top
Section Planes
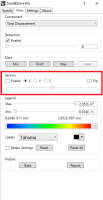 Dynamic section planes can be used to examine the solution results in areas of the solid that are normally difficult to see or inaccessible. Examples include the interior of the solid, or small crevices obscured by other parts of the solid. Watch Intact Solutions' video “Getting Started with Scan&Solve Pro Part 2: Analyzing Results” from 2:09 to learn more about using section views.
Toggle On/Off Check the [Enable] box to turn section planes on or off. The current settings will be preserved while section planes are toggled off.
Change Axis The Axis controls change the orientation of the section plane to align with one of the three coordinate axes. Switch between them to find the most optimal view for the area to be examined.
Section Plane Location
The position of the section plane is controlled by changing the slider position. Fine control of the slider is possible through left-clicking on the slider axis in the direction to move the section plane.
Flip Direction The Flip control is used to change the direction of the sectioned display. When unchecked, the filled area will progress from the negative direction to the positive direction of the axis. When checked, the filled area will progress from the positive to the negative direction of the axis.
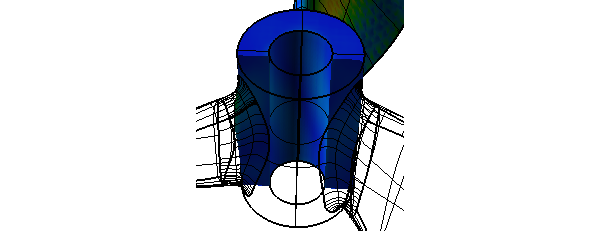
Example In the preceding model, the inner face of the tubular central shaft is completely obscured by the surrounding geometry, but with section planes the results can be examined.
Min/Max Ranges
The legend limits may be adjusted to bracket specified ranges of solution values. Different limits may be specified for each solution component. To learn more on how to use the max/min sliders, watch Intact Solutions' video “Getting Started with Scan&Solve Pro Part 2: Analyzing Results” from 2:32.
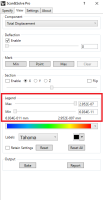
Max slider controls the maximum value displayed on the legend. The adjacent edit box shows the current maximum legend value and supports manual entry of the maximum value. Areas with this value or larger on the component will appear as the color farthest right on the color scale.
Min slider controls the minimum value displayed on the legend. The adjacent edit box shows the current minimum legend value and supports manual entry of the minimum value. Areas with this value or less on the component will appear as the color farthest left on the color scale.
The readouts under the sliders indicate the minimum and maximum values of the currently displayed component.
Examples
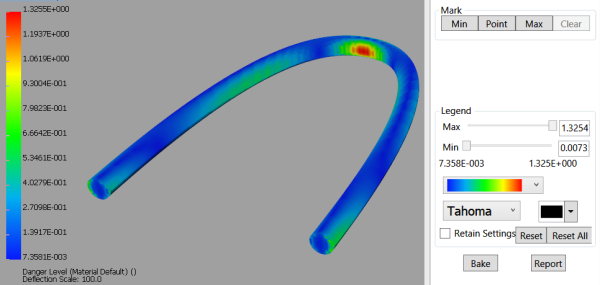
The following is an example of the unmodified Min and Max ranges, and their effect on the rendered solid.
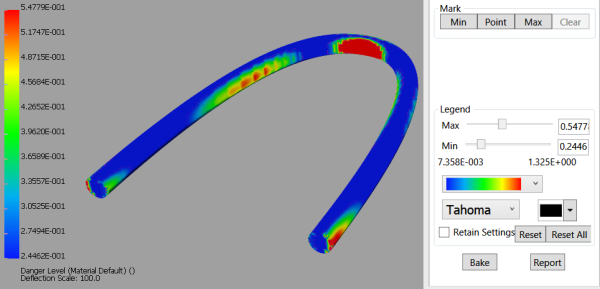
The following is an example of modifying the Min and Max ranges, and the effect on the rendered solid.

