
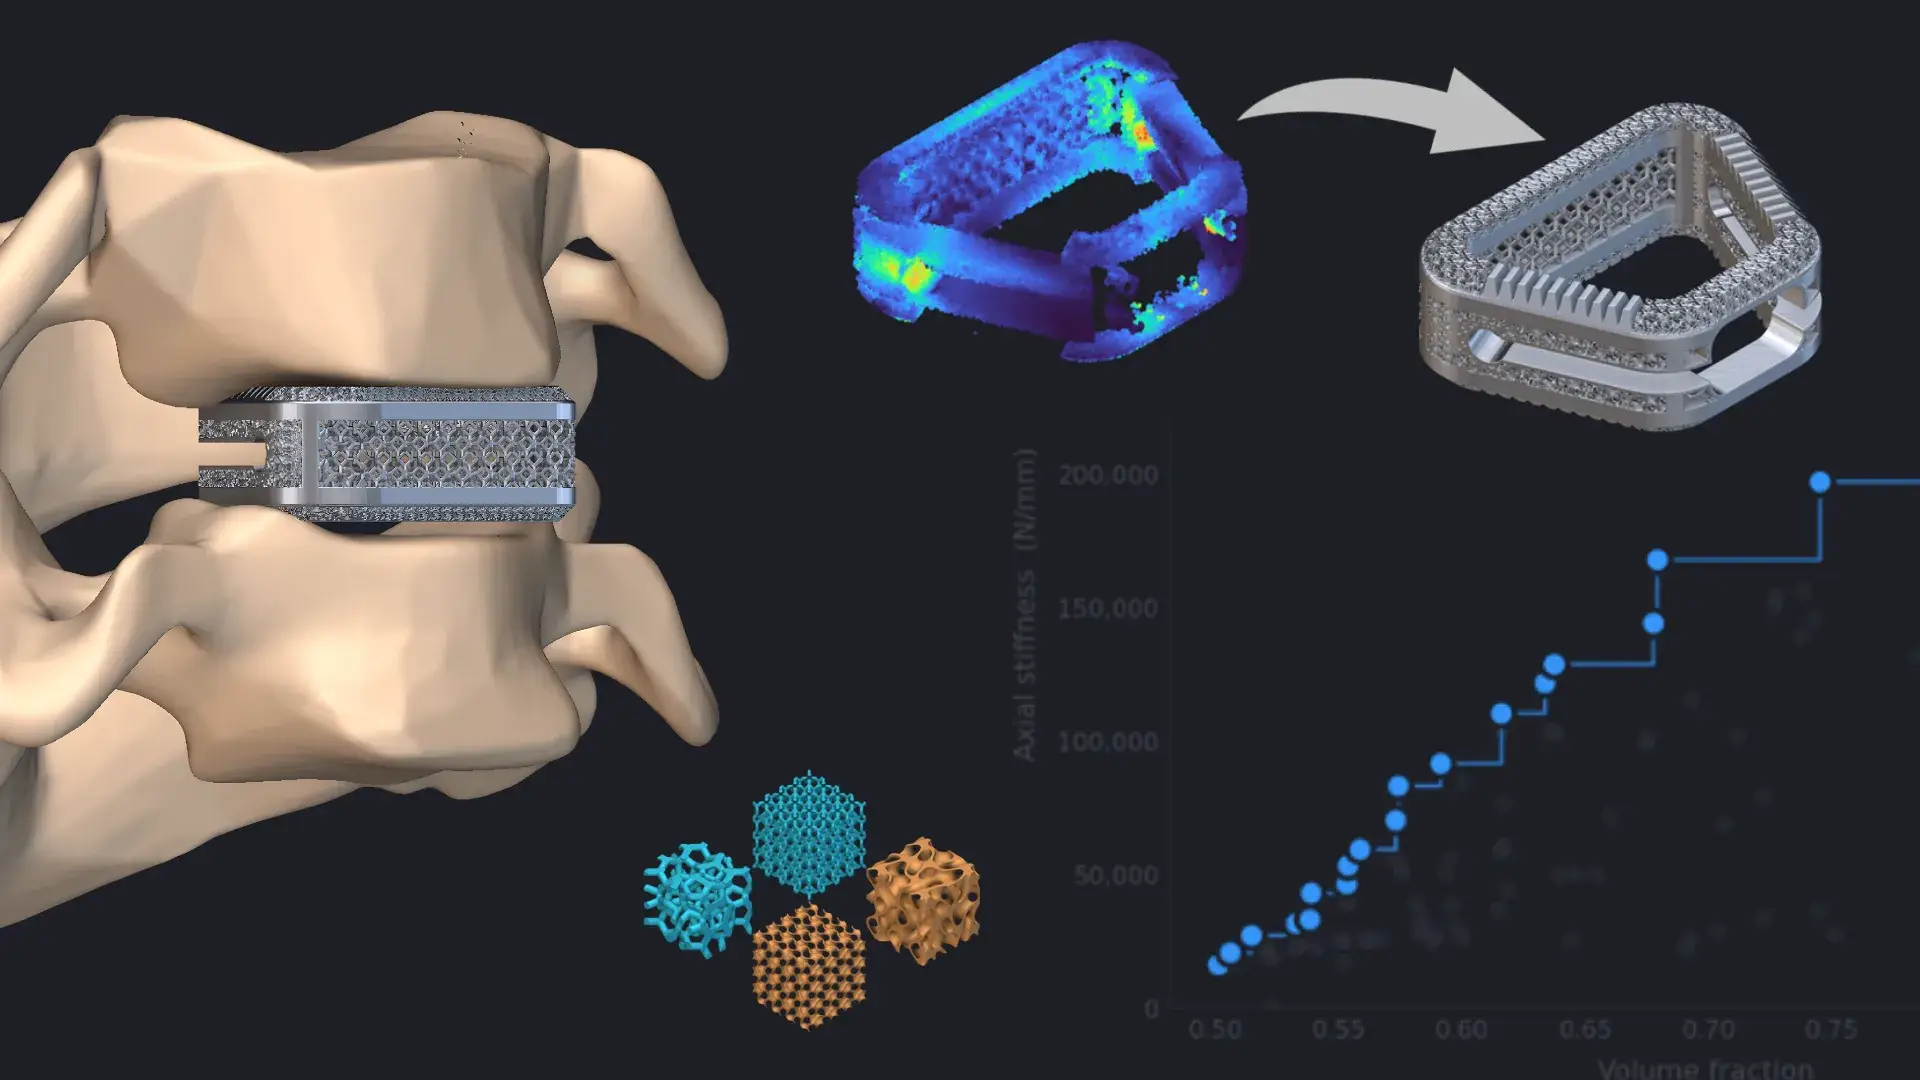
Metal additive manufacturing has enabled a new generation of spinal implants with complex porous lattice structures. Traditional solid metal implants limit patient-specific design and, while strong, are much stiffer than the surrounding bone, which raises biocompatibility concerns. Porous lattices, by contrast, have been shown to promote bone in-growth and, combined with metal AM, open new avenues for patient specificity while retaining the strength needed for long-lasting, fatigue-resistant implants.[2],[3]
The geometric complexity of these implants, and the pressure to accelerate development, demand simulation that keeps pace with design iteration. Intact.Simulation for nTop works directly on implicit geometry, evaluating each design change without the preparation overhead of conventional FEA.
Simulate complex implicits
Analyze intricate implicit geometry inside nTop, with no conversion, transfer, repair, or meshing steps.
Field-driven design loops
Stress fields drive local geometry updates: simulate, update fields, and re-simulate with the same boundary conditions.
Automated analysis of the design space
Intact.Simulation and nTop Automate run hundreds of implicit lattice variations across multiple physiological load cases without interruption, supporting data-driven decisions in a design space that traditional FEA cannot automate.
01
Analyzing a latticed spinal implant
The workflow begins in nTop, where an implant CAD model is converted to an implicit body and modified with two distinct parametric lattice regions (Figure 1).
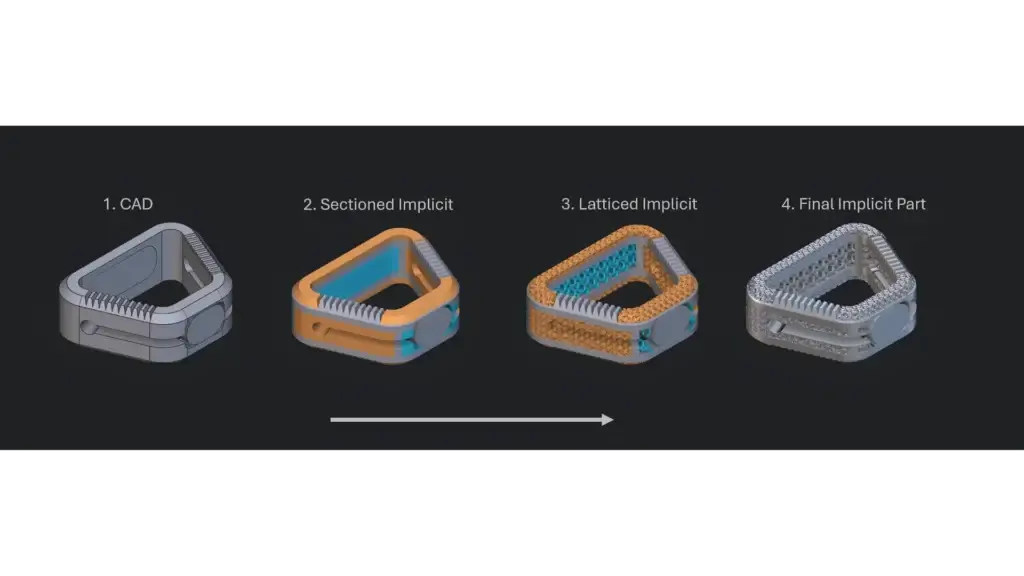
Figure 1: Overview of workflow design generation from CAD to sectioned implicit, latticing, and final implicit latticed implant
The latticed implant is subjected to a combined loading scenario: a -900 N (Z) compressive force and a torsional 13 J (-X) remote moment with restraint on the bottom surface. The vector force and fixed restraint are applied via native nTop boundary condition blocks using CAD surfaces from the original geometry; the remote moment is applied via an implicit body mask to the implant’s upper contact region. (Figure 2)
The initial geometry is assigned Ti-6Al-4V, a common biomedical AM alloy chosen for its biocompatibility and strength, with a Young’s modulus of 113.8 GPa and Poisson’s ratio of 0.342.[2] This simplified single-component analysis is meant to drive implant design; it does not model the full spinal column or surrounding tissue.
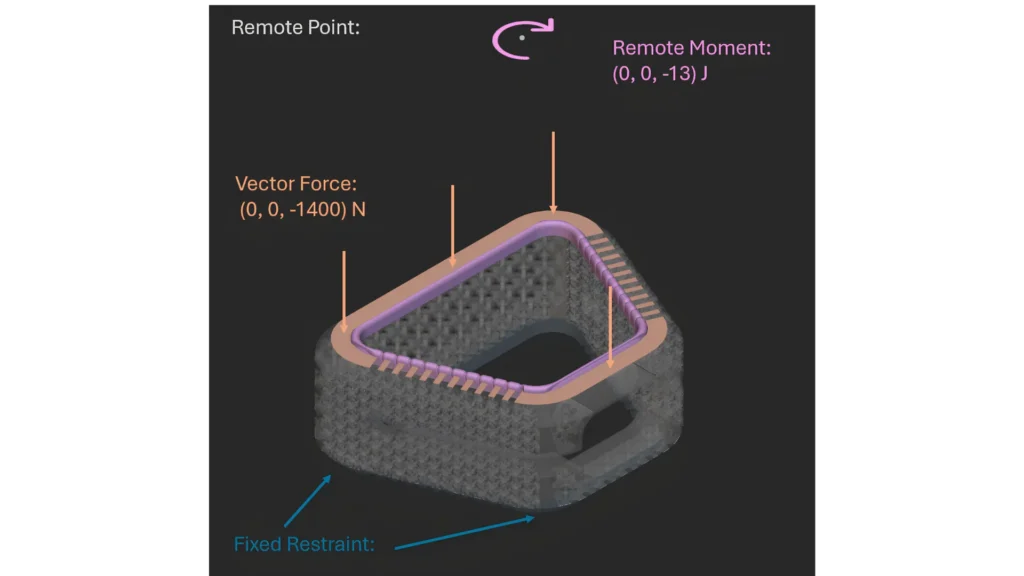
Figure 2: Initial loading conditions applied to the implant via Intact.Simulation including fixed restraints, a downward vertical load, and a torsional moment.
The baseline analysis runs directly on the implicit implant (532k nodes) in under three minutes. It tracks two quantities of interest: peak von Mises stress and range of motion.
- Maximum von Mises stress highlights highly loaded regions that may warrant attention when assessing structural integrity and fatigue.
- Range of motion (ROM) measures the angular change of a vector from the implant centroid to a top-corner point before and after deformation. In this single-component setup, it shows how much the implant deforms under the applied torsion, indicating its torsional compliance. (Figure 3)
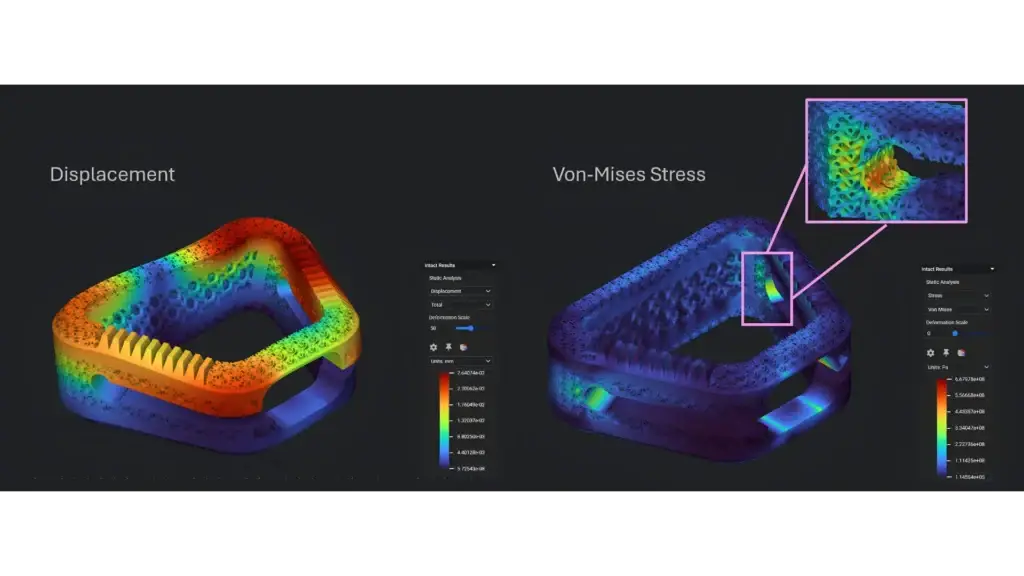
Figure 3: Finite element analysis results from Intact.Simulation for the initial implant design. Displacement magnitude with deformation scale of 50 on the left and von Mises stress with lattice region highlight on the right.
The initial design shows a maximum von Mises stress of 668 MPa, below the 930 MPa yield strength, but fatigue failure remains a concern. For Ti-6Al-4V, the implant should not exceed a max stress of 400 MPa to withstand the required 10 million cycles per ASTM standard F2346-05 for intervertebral implants.[1]
The range of motion is 0.11°, indicating the implant is quite stiff, as expected for titanium. Options for more compliant designs include using a less stiff PEEK material instead of titanium or lightweighting further with more porous latticing. Generally, spinal implant compliance is a design variable rather than a universally good or bad outcome, and it depends strongly on the individual patient’s physiology and vertebral mobility.[2] More information, a more complete analysis model, and ideally testing would be needed to make a design decision with confidence; however, ROM is useful to track throughout the design process.
02
Field-driven design with Intact.Simulation
The scalar stress field from the initial simulation can drive each lattice region’s strut thickness locally instead of using a single global value. High-stress regions get more material; low-stress regions become opportunities for weight reduction or higher porosity. Here, stresses of roughly 0.3 to 400 MPa map linearly to a ramped thickness field of 0.1–0.8 mm in the first lattice region and 0.2–0.6 mm in the second (Figure 4).
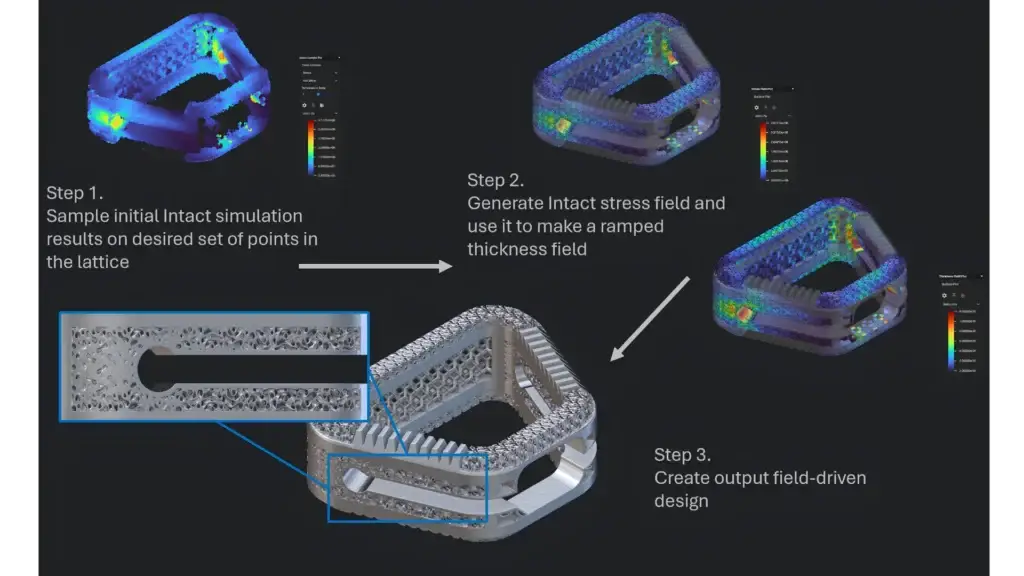
Figure 4: Overview of the field-driven workflow from Intact.Simulation stress results to mapped thickness field and resulting field-driven design.
Because Intact.Simulation evaluates implicit geometry natively with the Immersed Method of Moments (IMM), there is no meshing or model pre-processing. The new field-driven geometry is re-simulated with the same boundary conditions by simply dropping in the new implicit body (Figure 5).
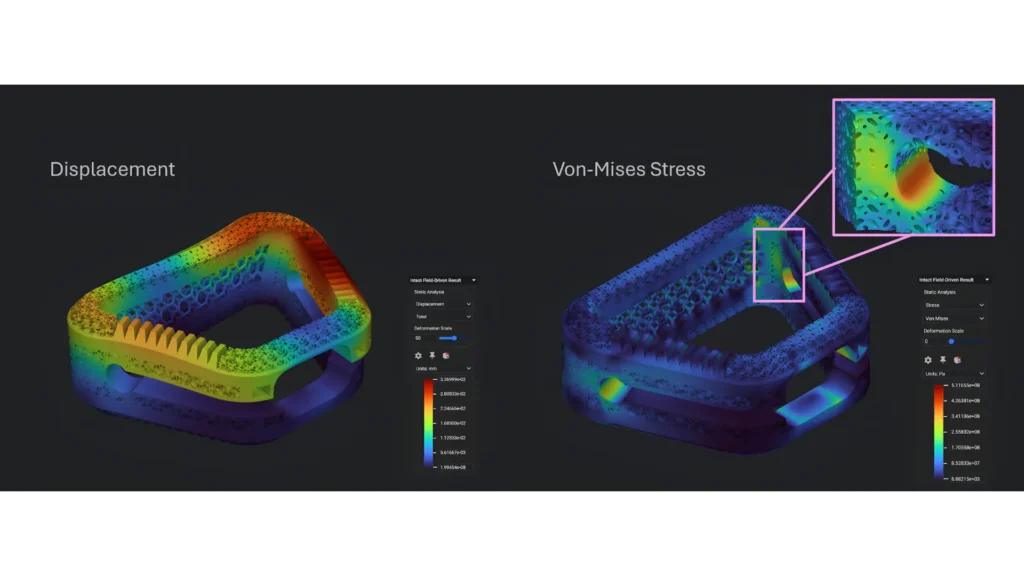
Figure 5: Finite element analysis results from Intact.Simulation for the field-driven implant design. Displacement magnitude with deformation scale of 50 on the left and von Mises stress with lattice region highlight on the right.
With locally varying lattice thickness, peak von Mises stress drops from 668 to 512 MPa while ROM increases from 0.11° to 0.13°. Peak stress remains above the 400 MPa fatigue threshold, but it occurs at the corner of the implant’s bottom teeth (Figure 6), so it is at least partly a product of the simplified restraints and loads. Within the lattice regions alone, the local maximum is 433 MPa, close to the fatigue threshold.
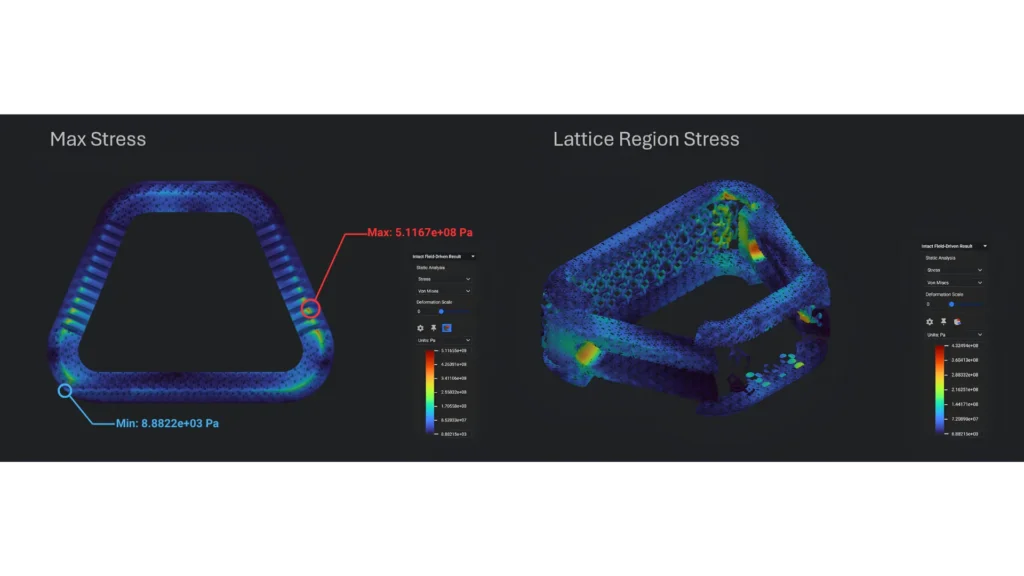
Figure 6: Intact.Simulation analysis results showcasing the maximum von Mises stress singularity on the left, and stress isolated on the desired lattice region on the right.
This gives designers what they need to judge whether the tradeoff is worthwhile and how to tune further. Because design and simulation live in the same environment, swapping lattice types, editing the thickness field mapping, or testing new load cases and boundary conditions never breaks or bottlenecks the design loop.
03
A multi-load case design of experiments
One design under one load case is not a complete evaluation. Spinal implants see varying load combinations in daily life, from cyclic walking and stair climbing to lifting and combinations of flexion, torsion, and bending. To evaluate performance systematically, an automated design-of-experiments (DOE) workflow sweeps lattice parameters across four load cases representative of standard physiological regimes. [1],[4] (Figure 7)
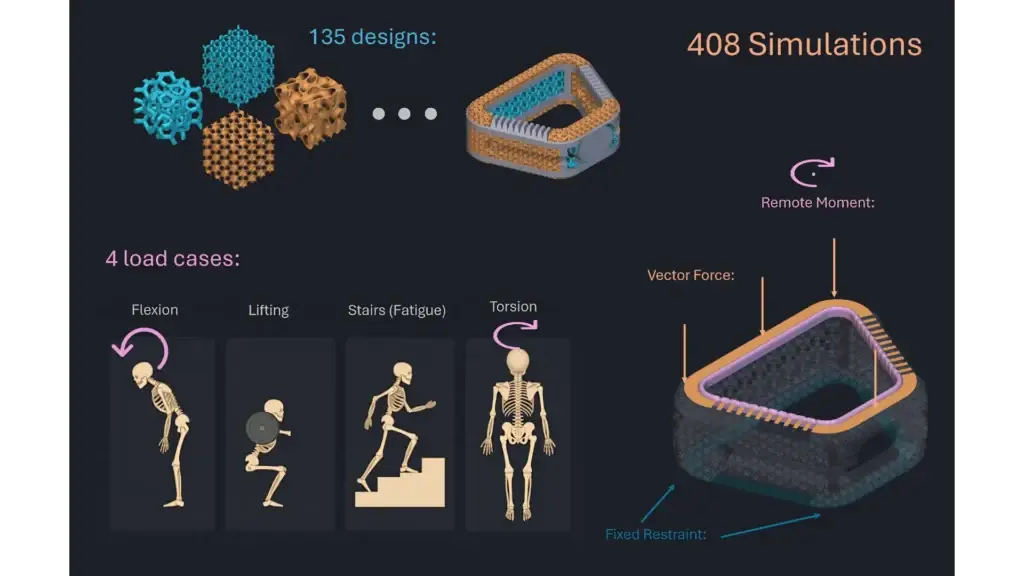
Figure 7: Overview of the lattice design variations for implants and the four selected physiological load cases resulting in 408 total simulations in the design of experiments.
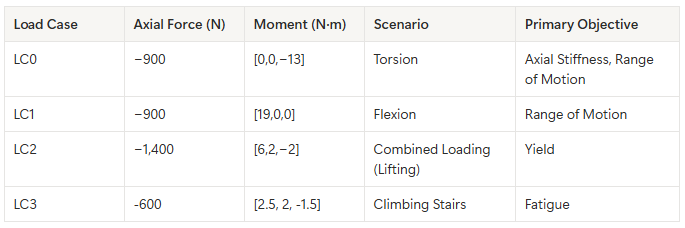
Each load case (Table 1) probes a different failure or performance concern:
- Torsion consists of a moment about the spinal column axis, testing the implant’s torsional compliance by measuring range of motion.
- Flexion represents forward bending, which introduces a strong bending moment additive to the compressive axial force. This case tests both yield stress and the directional compliance via its range of motion.
- Lifting/Combined loading applies axial, lateral, and torsional components simultaneously, making it ideal for checking against yield stress throughout the design sweep.
- Climbing Stairs/Fatigue applies a lower-magnitude cyclic load representative of repetitive gait loading. Peak stress is lower in absolute terms, but the stress amplitude drives the fatigue failure metric over millions of cycles.
Table 1: Four load cases used for the design of experiments study, including torsion, flexion, combined loading, and stair climbing with their forces, moments, and primary objective
The geometric design space covers both lattice regions: unit cell, cell size, and strut thickness (Table 2).
Table 2: Selected parameters and their variations for the design of experiments study.
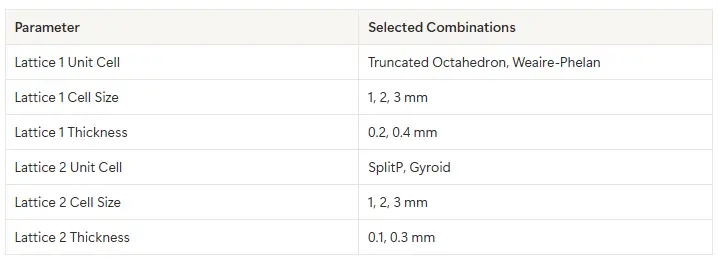
The full sweep produced 408 simulations and 135 unique designs across the four selected load cases. In total, the sweep took about 18 hours, averaging under two minutes per-simulation. Each run is driven by an nTop Automate script that generates a per-run input JSON, invokes nTopCL, collects the output, and writes a row to a results CSV.
Every run records:
- Interface porosity (porosity of lattice 2)
- Overall volume fraction relative to the solid CAD
- Axial stiffness (N/mm)
- Peak von Mises stress
- Range of motion, averaged over five sample points
Before investigating these individual quantities, the variance of each quantity of interest gives a broader picture of the design space (Figure 8).
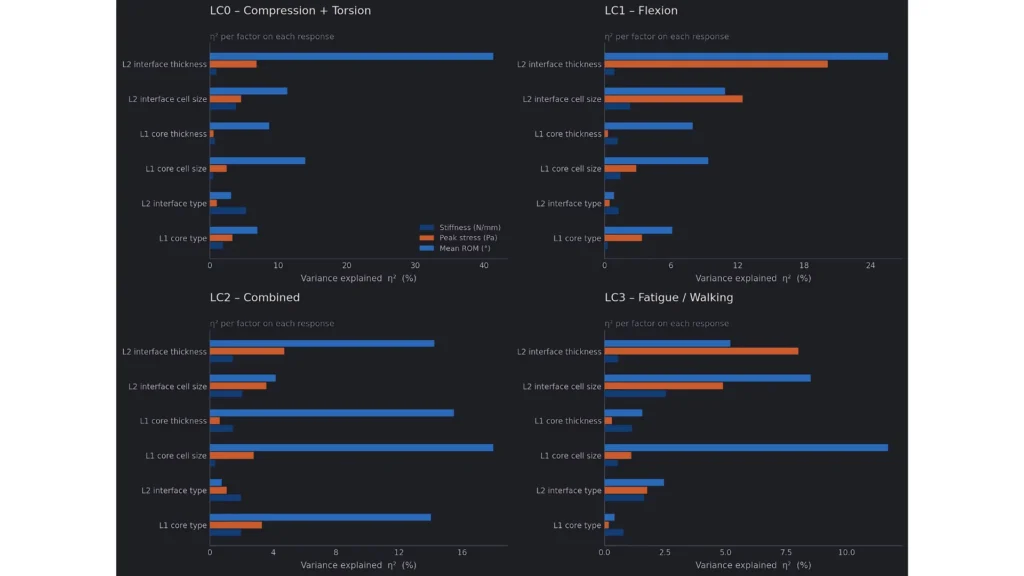
Figure 8: Plots for each of the four load cases indicating the quantity of interest’s variance with all parameter changes.
Stress depends strongly on interface lattice thickness, making it a key variable for reducing peak stress and that the design space may be a bit coarse across that parameter. This is expected, as only two thicknesses were used as bounds on feasible designs; sweeping between these values would be valuable. Mean ROM shows high variance, with parameters such as core lattice thickness, that barely affect axial stiffness or peak stress, so these can tune compliance without raising stress. Finally, the two lattice cell types show different variances between load cases, suggesting that certain lattice structures are better suited to certain directional loading.
With a broad view of which parameters affect which quantities of interest, a deeper look at the design can explain which parameters are viable for stress (Figure 9).
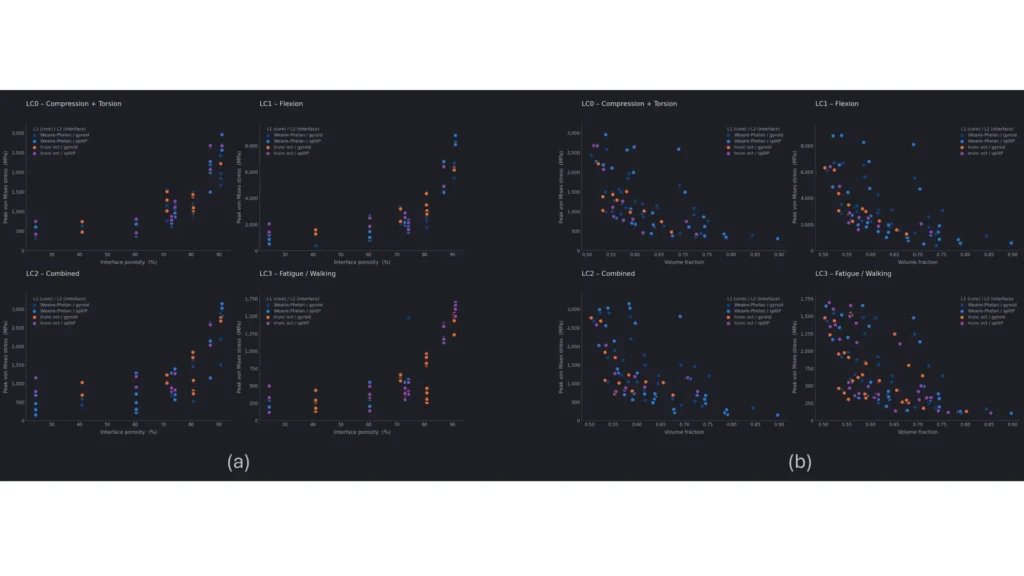
Figure 9: Plot of peak von Mises stress versus interface porosity (a), and total implant volume fraction (b) for every design in each of the four load cases.
Looking at the entire design space in terms of von Mises stress compared with design interface porosity/overall volume fraction yields a few useful takeaways. Namely, the relationship between interface porosity and peak stress shows that moving from the low-porosity band (20–40% interface porosity) to the high-porosity band (60–80%) increases median peak stress by roughly 2–3× depending on the load case. For yield stress, designs with interface porosity greater than 75% or overall volume fraction less than 60% quickly become infeasible, as stresses exceed Ti-6Al-4V’s yield stress. For example, under flexion, the median jumps from approximately 726 MPa in the low-porosity band to over 2,100 MPa in the high-porosity band.
Fatigue follows a similar trend, exceeding 400 MPa even for the best designs in the high-porosity/low-volume-fraction bands, but feasible designs still exist below this limit above 80% porosity or under 55% volume fraction. The failures, especially for peak stress, provide strong insight into what design ranges are valid. To land on an ideal design, more effort would be needed to smooth out some of these extremely high local maxima, either by running a second, more robust/fine-tuned sweep across lattice thickness or by incorporating field-driven thicknesses into an automated loop.
The next quantity of interest is range of motion (Figure 10).
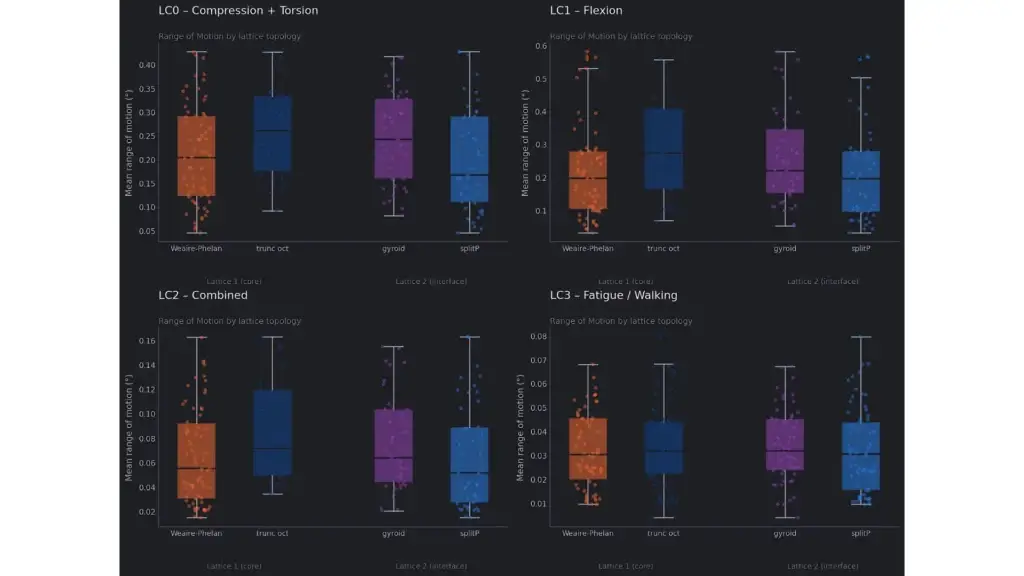
Figure 10: Plots of mean range of motion against the two lattice region’s cell topology types for each of the four load cases.
Range of motion results indicate that truncated octahedron for lattice 1 and gyroid for lattice 2 are generally more compliant than Weiare-Phelan and splitP. Because lattice type has little effect on peak-stress variance relative to range of motion, changing lattice topology is an effective way to tune implant compliance for each load case.
A Pareto front identifies the best designs in terms of peak stress and axial stiffness. Twelve designs were selected, one from each of the low, medium, and high porosity bands of all four load cases and are displayed with the relevant Pareto plots (Figure 11).
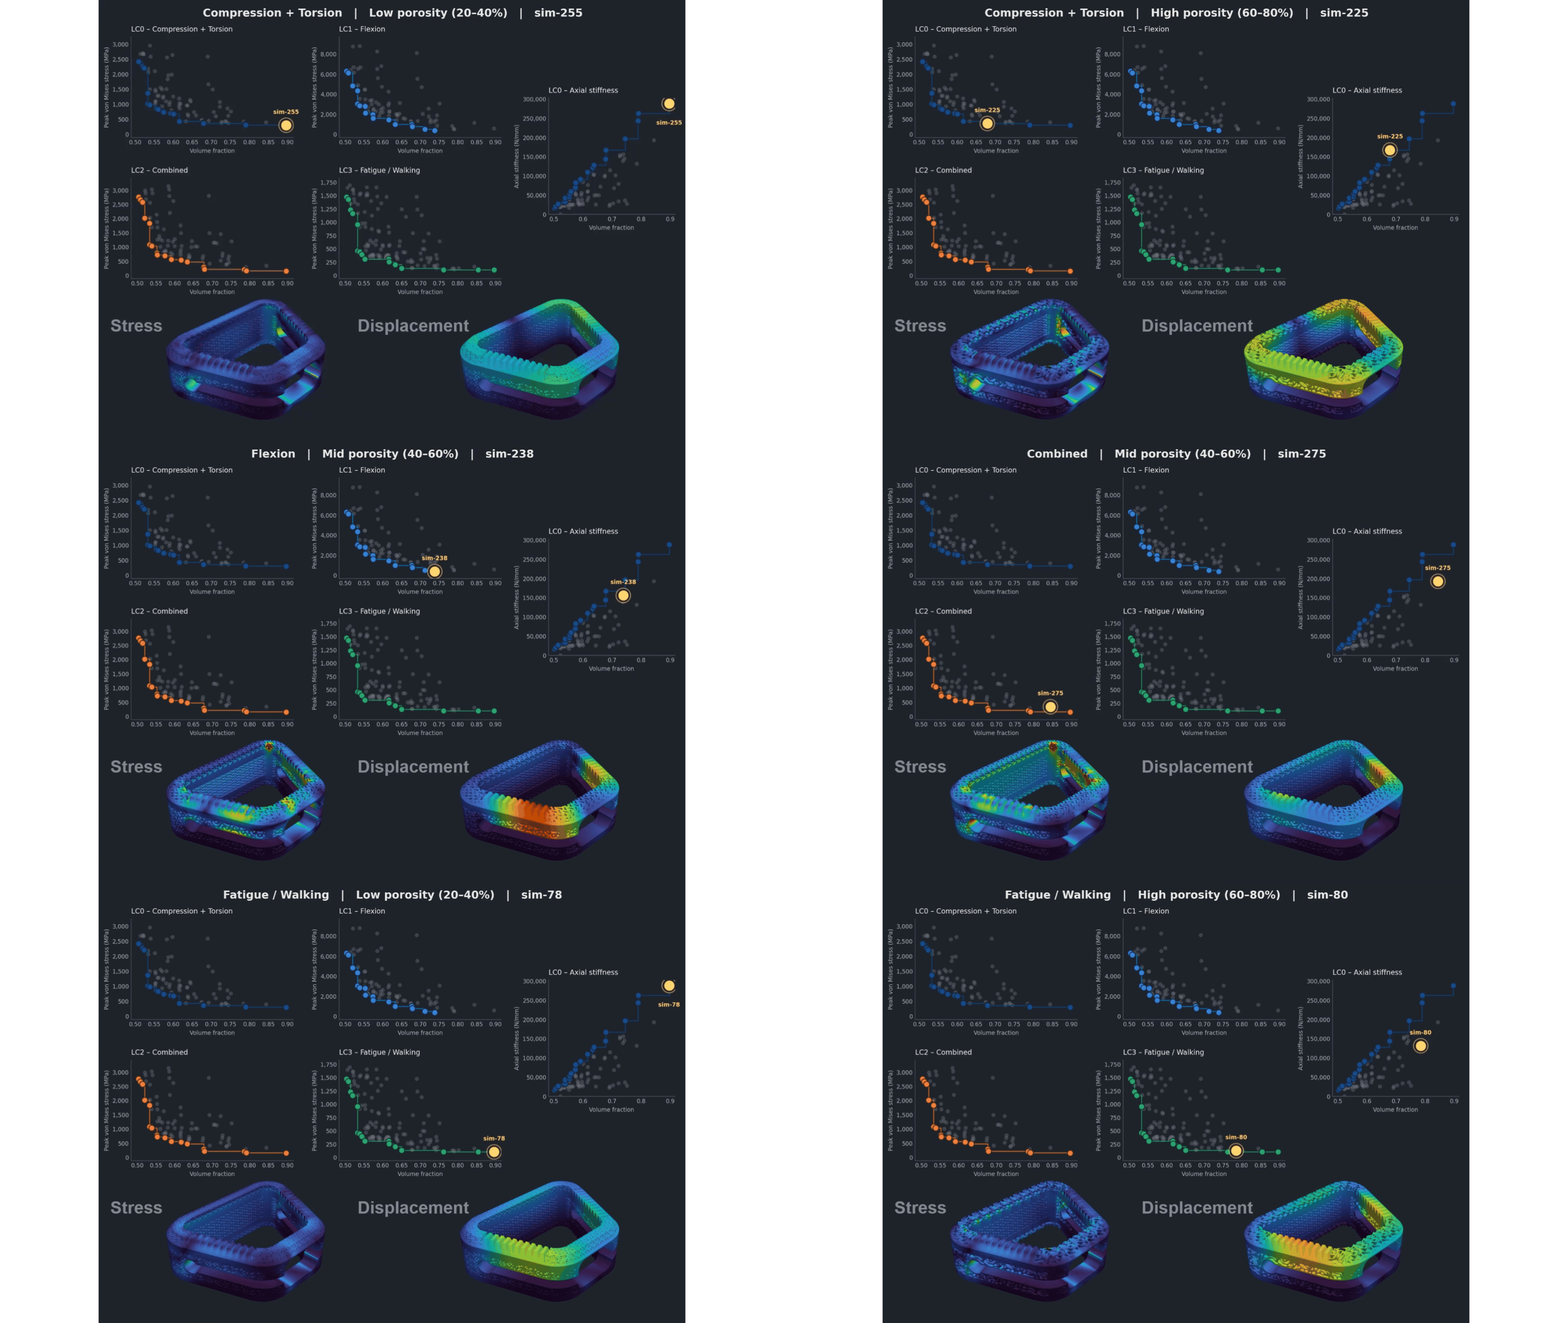
Figure 11: Pareto fronts of peak von Mises stress versus implant volume fraction for each load case, plus axial stiffness versus volume fraction for the selected compression case. Bottom: stress and displacement fields for the highlighted design and load case.
THE TAKEAWAY
Simulation that keeps pace with implant design
Integrating Intact.Simulation with nTop and nTop Automate gives engineers a streamlined way to evaluate and optimize complex implicit lattice designs without the preparation overhead of conventional FEA, making it practical to simulate a new generation of additively manufactured porous spinal implants.
- Direct simulation on implicits eliminates meshing bottlenecks for complex AM lattices.
- Field-driven design loops use stress fields as direct inputs to local geometry updates in nTop.
- Automated design space exploration runs multi-load-case DOE sweeps to expose structural tradeoffs with data.
Medical device engineers can explore parametric design spaces that traditional simulation tools cannot reach, accelerating the path to optimized, patient-tailored implants.
References
- Cortis, G., Agostinelli, A., & Cortese, L. (2025). Structural finite element analysis of the lumbar spine applied to the conceptual design of a compliant interbody cage implant. Journal of the Mechanical Behavior of Biomedical Materials, 175, 107314. doi.org/10.1016/j.jmbbm.2025.107314
- Wang, R., & Wu, Z. (2023). Recent advancement in finite element analysis of spinal interbody cages: A review. Frontiers in Bioengineering and Biotechnology, 11, 1041973. doi.org/10.3389/fbioe.2023.1041973
- Zhang, Z., Li, H., Fogel, G. R., Liao, Z., Li, Y., & Liu, W. (2018). Biomechanical analysis of porous additive manufactured cages for lateral lumbar interbody fusion: A finite element analysis. World Neurosurgery, 111, e581–e591. doi.org/10.1016/j.wneu.2017.12.127
- Liu, J.-T., Chen, W., & Wei, H.-W. (2017). Biomechanical evaluation of a dynamic fusion cage design for cervical spine: A finite element study. Advances in Mechanical Engineering, 9(5). doi.org/10.1177/1687814017698881